AMD Backtester
Automated backtesting engine for an institutional price-action strategy on XAU/USD.
- Lines of Python
- ~11.9k
- Strategy modules
- 26
- Sample run expectancy
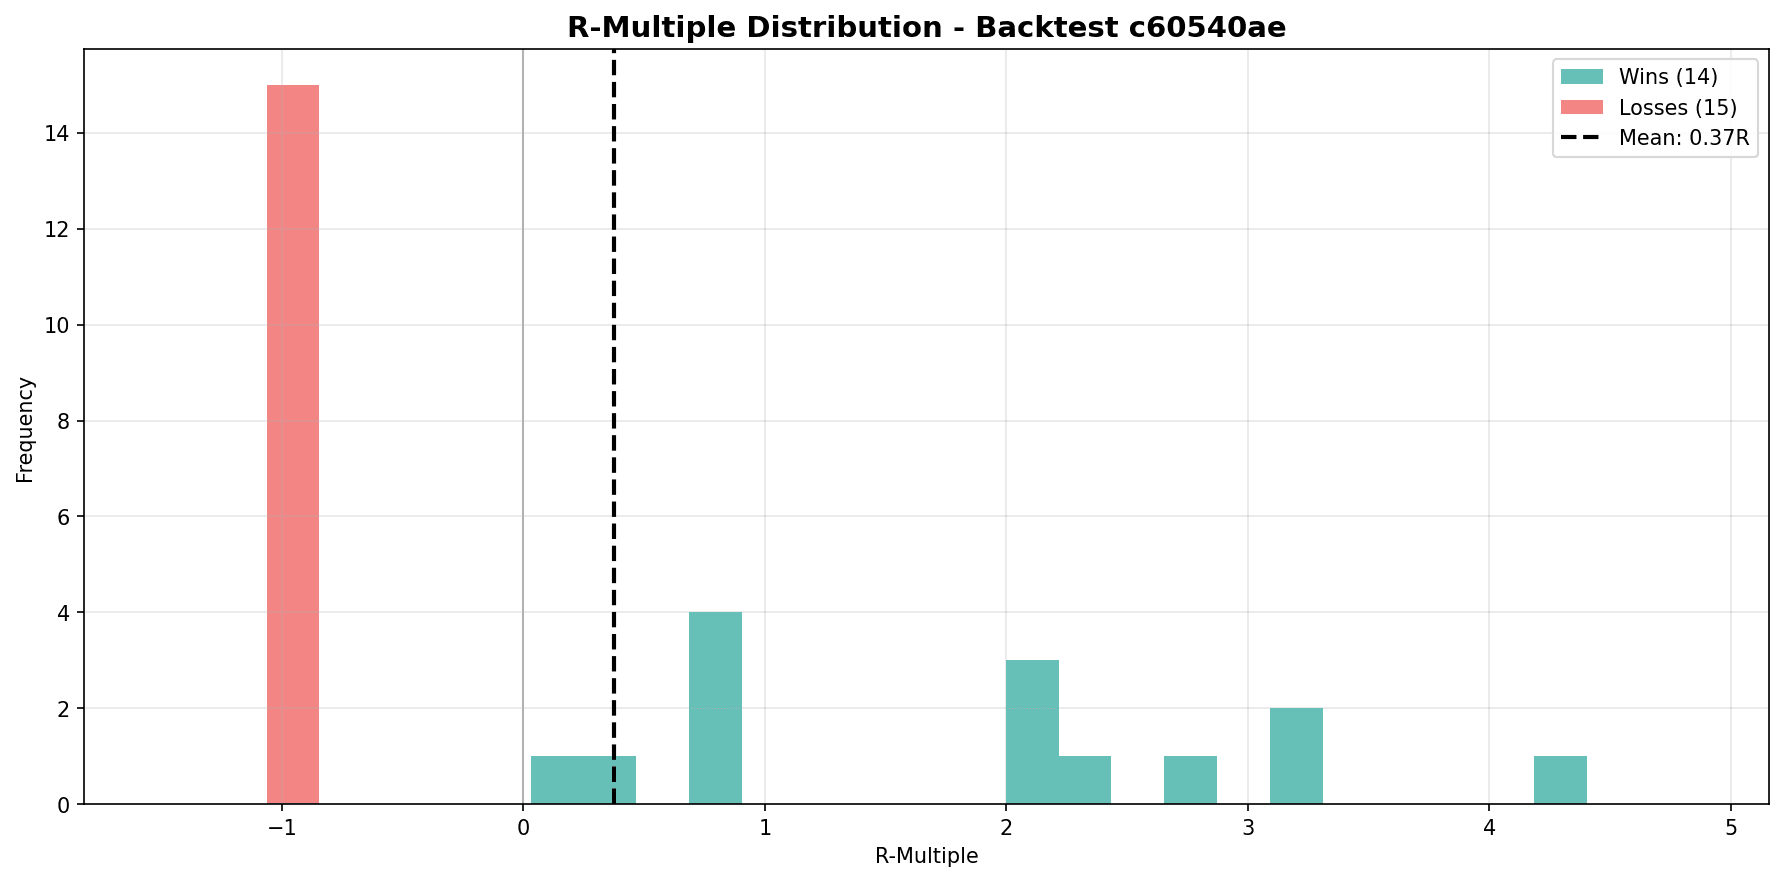
- +0.50R
- License
- MIT
Solo engineer
- Python
- PostgreSQL
- MetaTrader 5
- Git
Problem
Price-action traders need a reproducible way to validate an Accumulation / Manipulation / Distribution hypothesis on gold, with realistic execution costs and session filters — not a toy notebook.
Approach
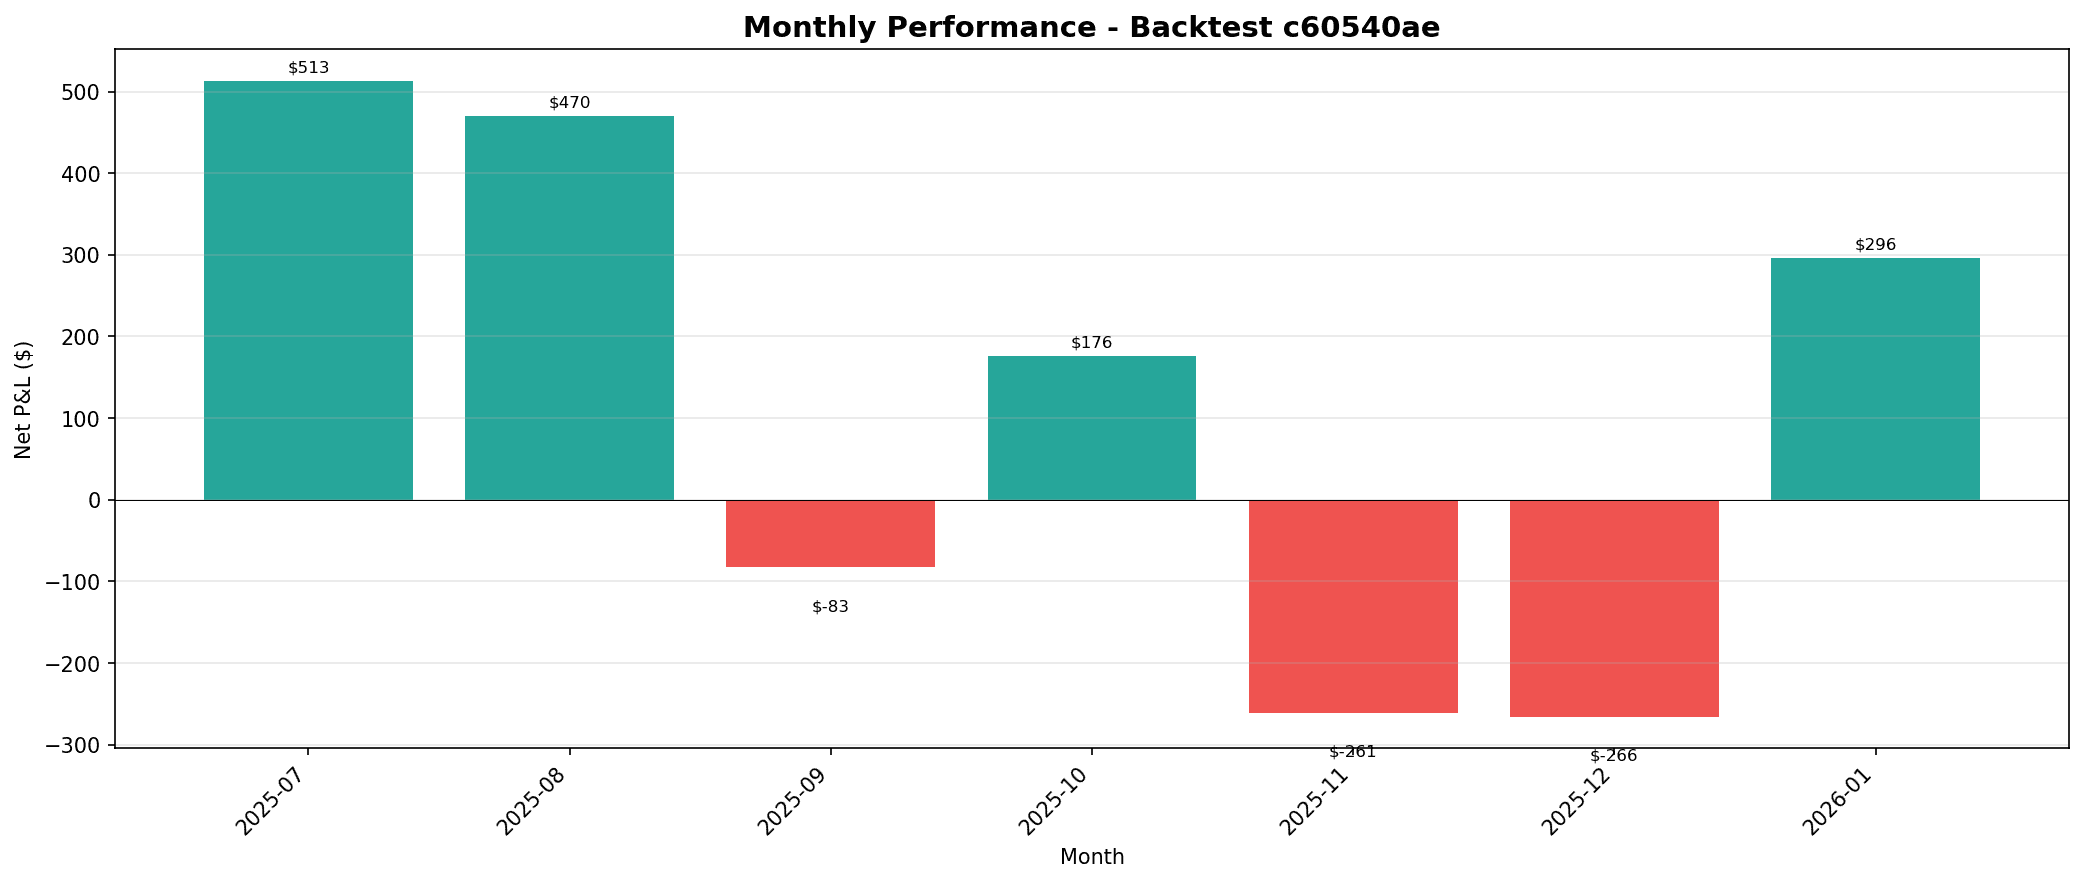
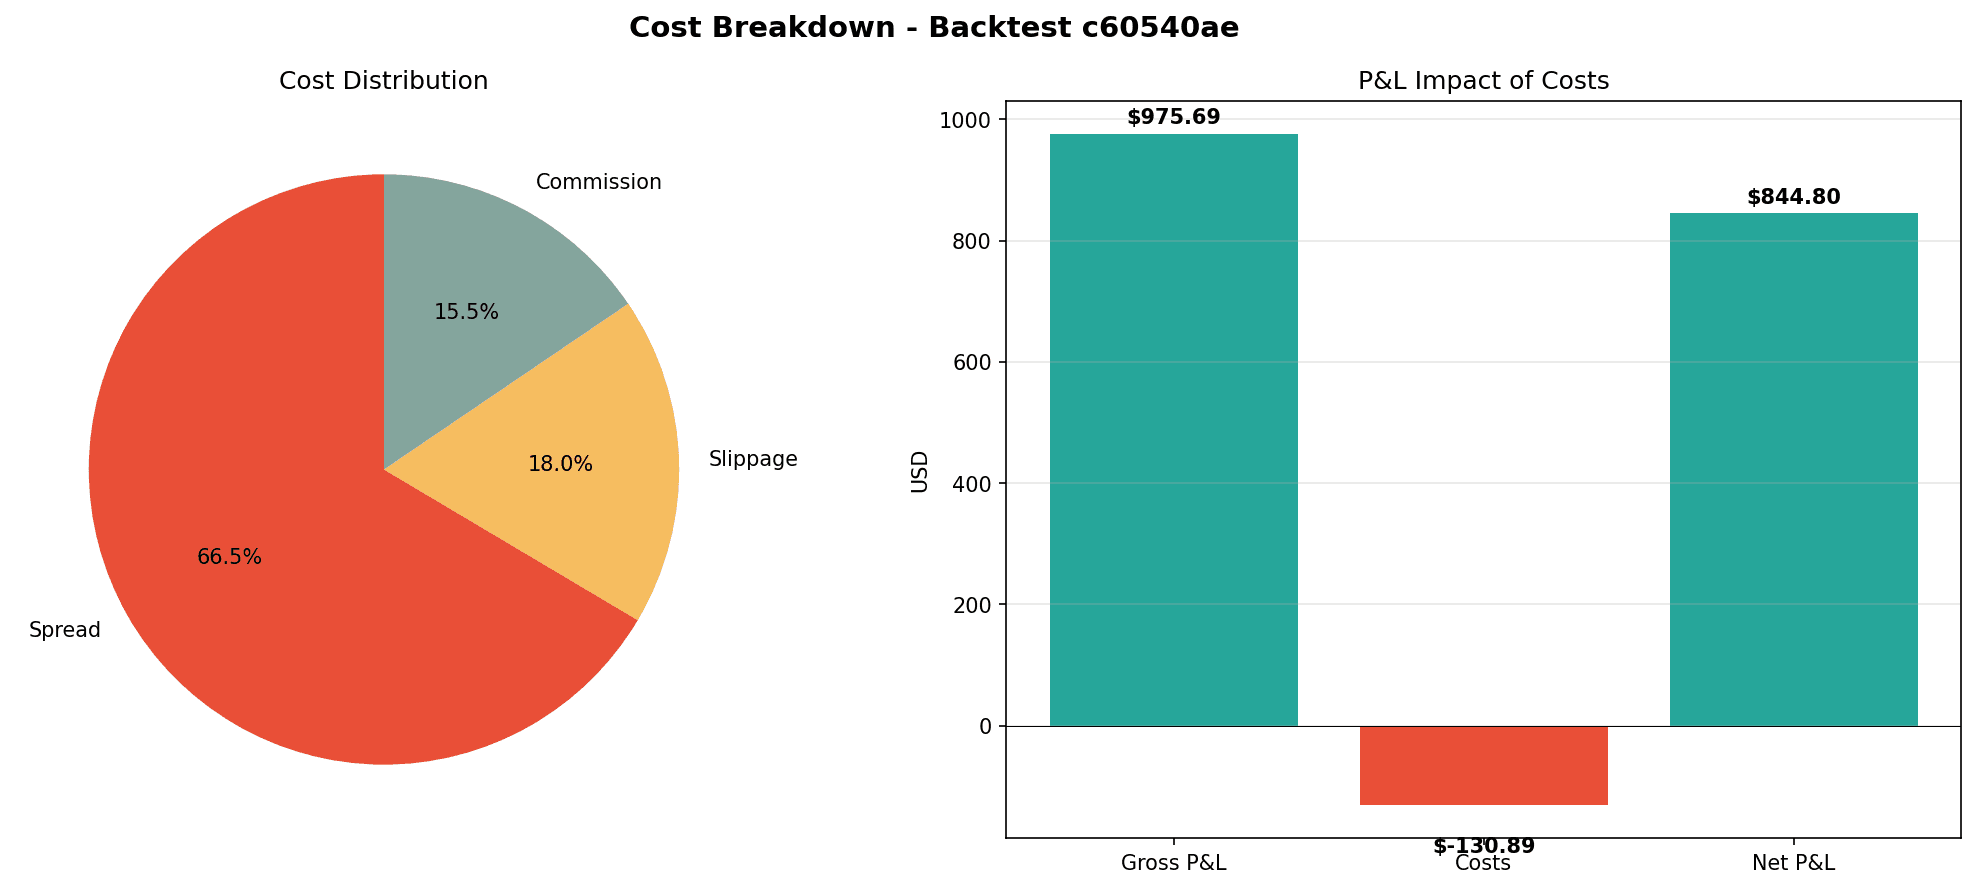
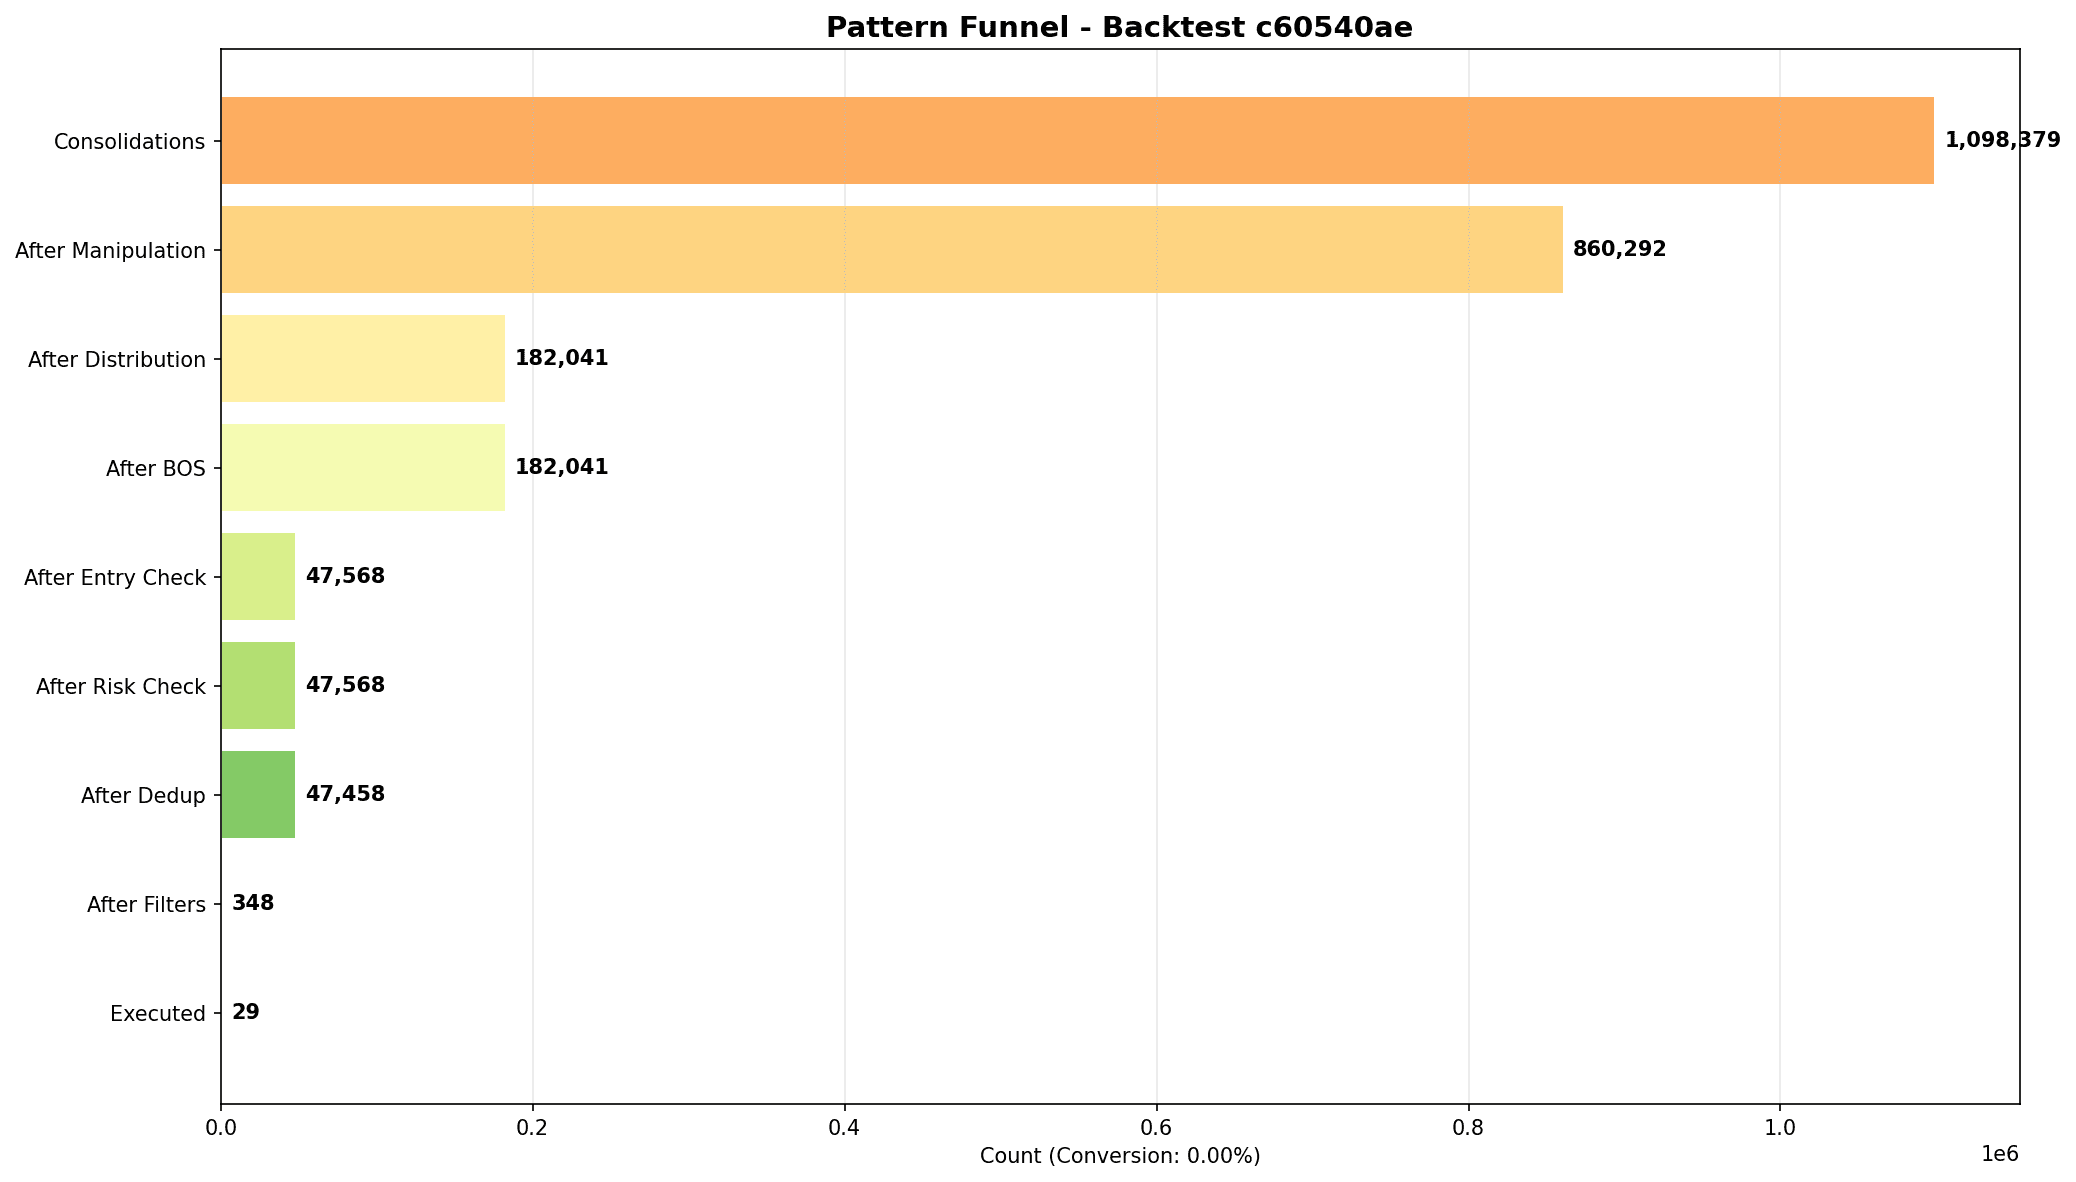
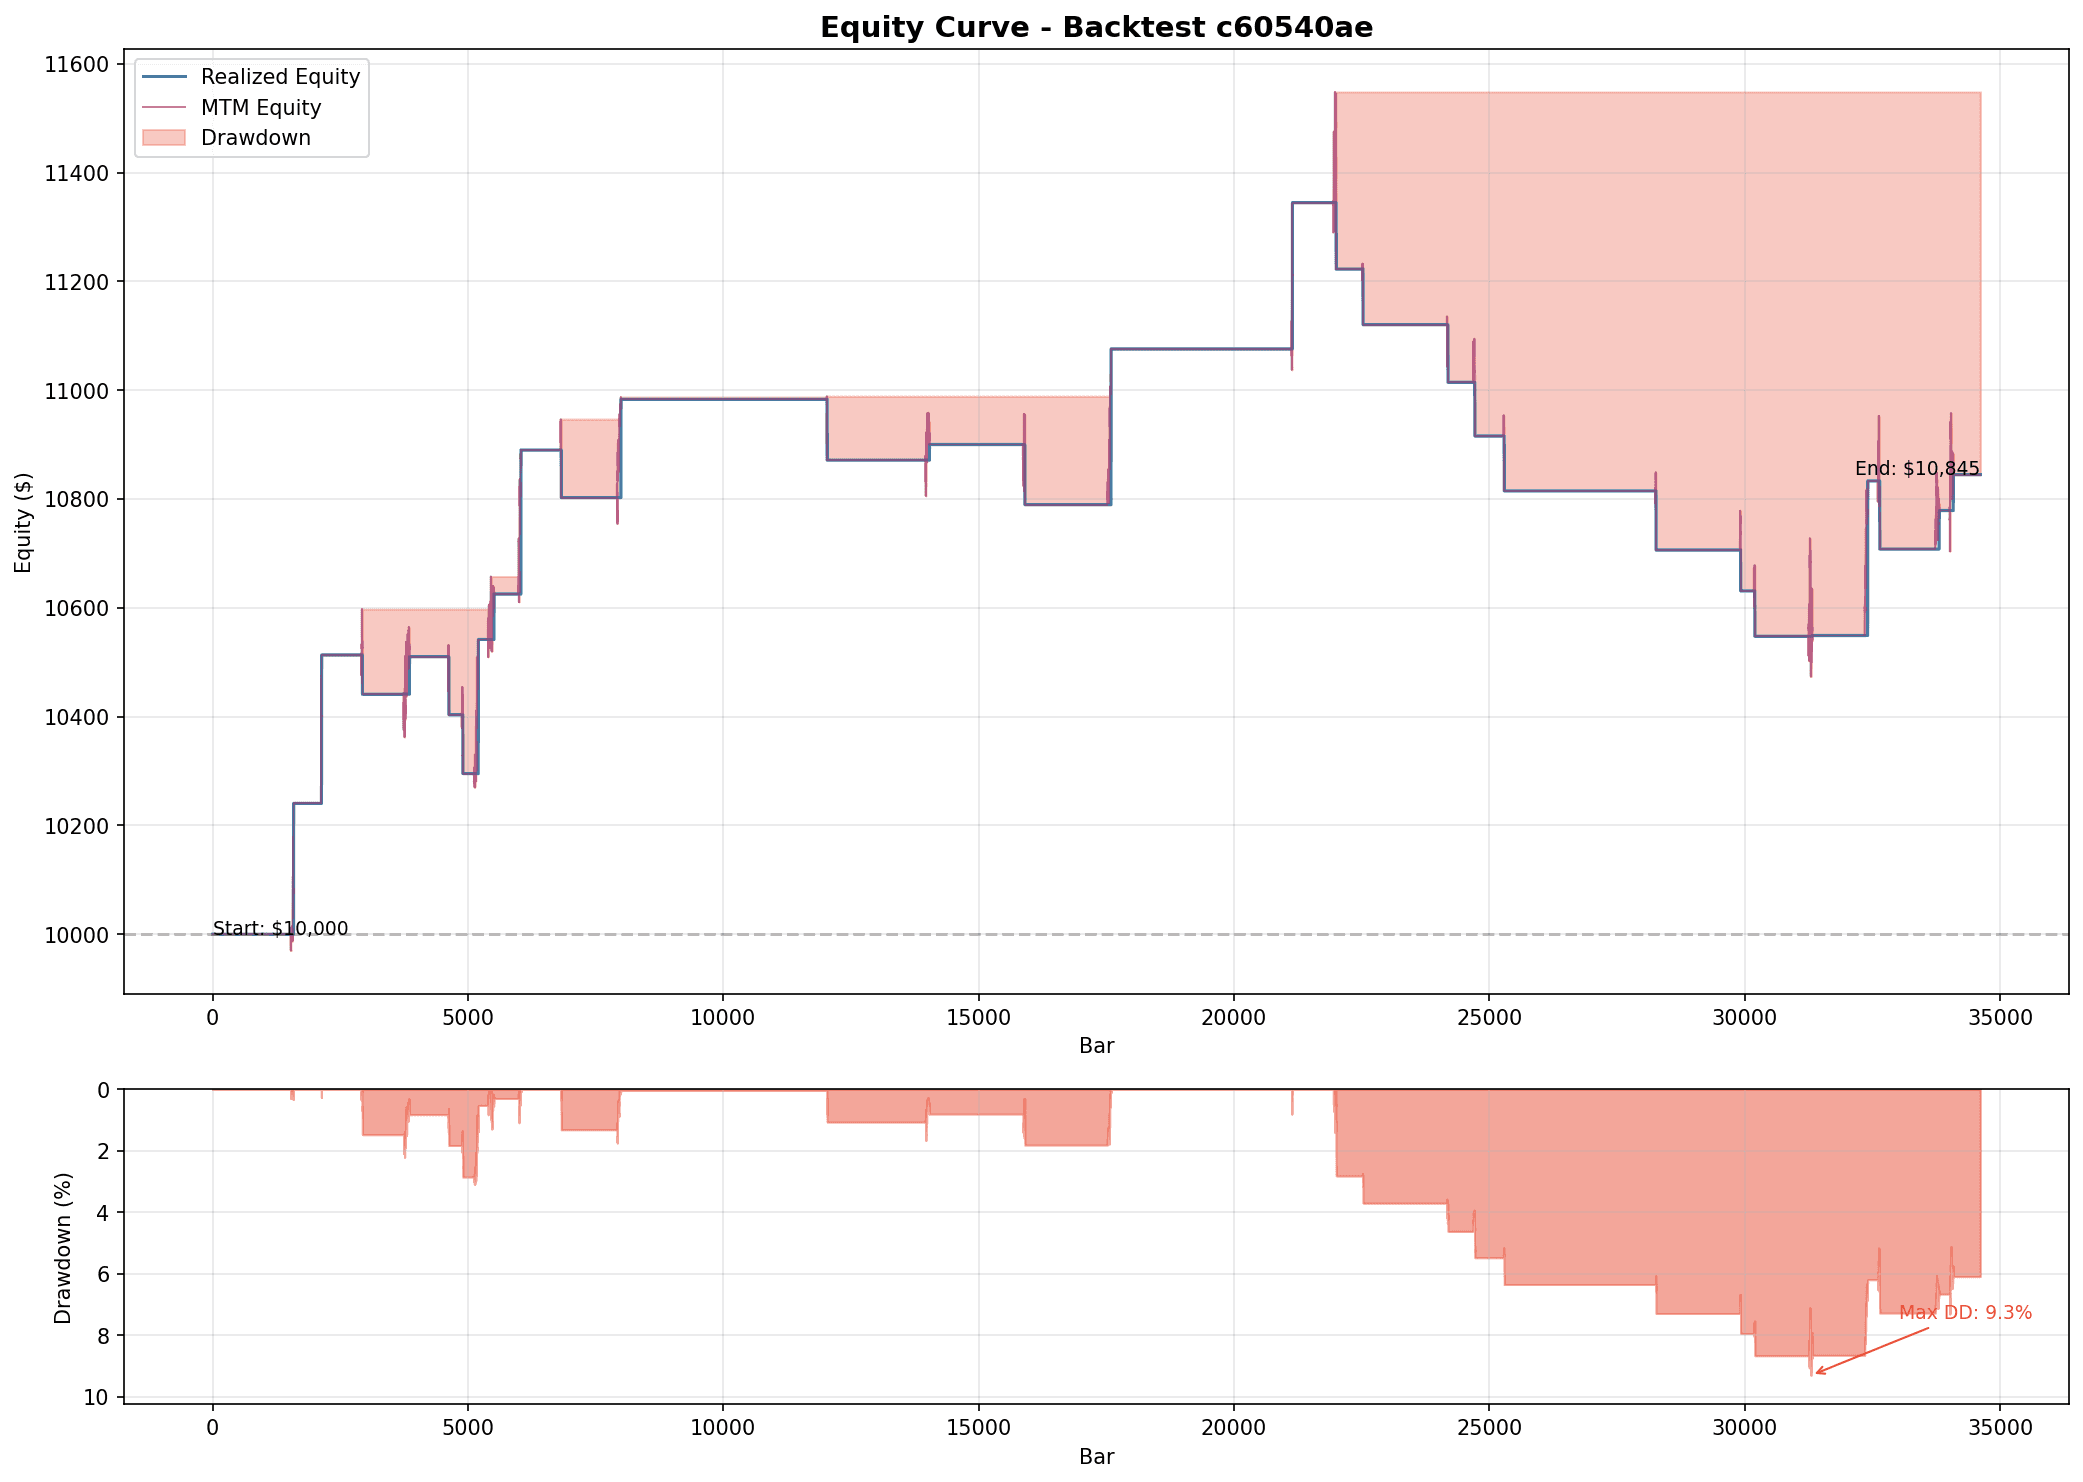
26-module Python engine: MT5 data ingestion, PostgreSQL cold storage, SMC confluence (FVG + order blocks), session filters, Monte-Carlo validation, and a pytest-backed core. Reports generate equity curves, trade funnels, cost breakdowns and monthly P&L.
Outcome
11.9k LOC, MIT-licensed, fully reproducible runs. Ships backtest artefacts as PNG + txt so results can be audited outside the repo.
Strategy thesis
The AMD pattern frames a day in three institutional phases: accumulation (tight range, liquidity builds), manipulation (a fake breakout that sweeps stops), and distribution (the real leg). Entries come on retest of the broken level with rejection confirmation, filtered by session and confluence with fair-value gaps / order blocks.
Engineering choices
Ingestion runs through the official MT5 terminal API; raw ticks and minute bars land in PostgreSQL so runs are reproducible. Strategy logic is split into 26 pure-function modules (indicators, consolidation detector, manipulation detector, distribution detector, entry, risk, filters) so each can be unit-tested. A Monte-Carlo layer resamples trade sequences to stress-test expectancy.
Why it matters for a portfolio
This is the piece that proves I can own a system end-to-end: data layer, strategy layer, risk layer, reporting layer, tests, and reproducible artefacts. No notebooks hiding bugs.